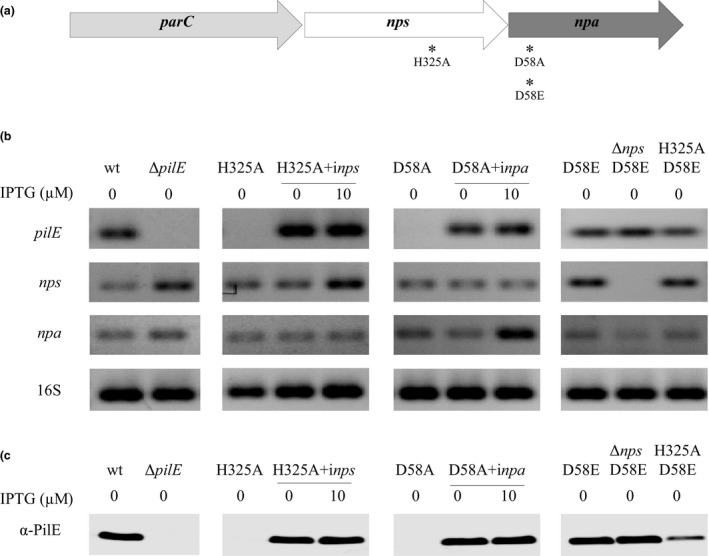
Figure 3.

pilE, nps, and npa transcript levels in Nel 29315 wt and nps and npa mutants. (a) Point mutations in the nps and npa genes are indicated by an asterisk. (b) Log phase cells were incubated with varying concentrations of IPTG for 4 hr, at 37°C. pilE, nps, or npa mRNA from the lysates was measured by RT‐PCR in the presence (+RT) or absence (−RT) of reverse transcriptase, using gene‐specific primers (see Table S2). The 16S rRNA reaction was used as a loading control and control for mRNA stability. Name of each mutant appears above each column. Primers targeting 16S rRNA were used as loading control and control of mRNA stability. IPTG concentration used to induce the genes for complementation appears above the columns. (c) Detection of PilE by western blot using anti‐PilE antibodies. H325A+inps, nps H325 complemented with wt nps under control of the IPTG‐inducible promoter; D58A+inpa, npa D58A complemented with wt npa under control of the IPTG‐inducible promoter; H325A D58E, nps‐npa double mutant
