
Figure 3.
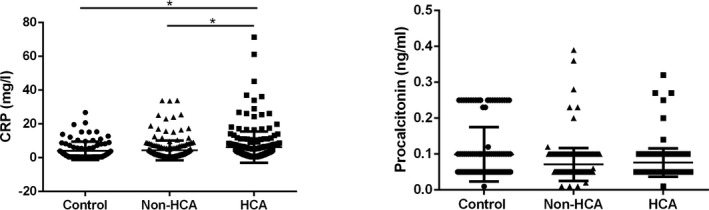
Comparison of the CRP and procalcitonin among different groups. Control, full‐term pregnancies; CRP, C‐reactive protein; HCA, histological chorioamnionitis‐related preterm birth; non‐HCA, non‐histological chorioamnionitis‐related preterm birth. *P < 0.05, **P < 0.01