
Figure 4.
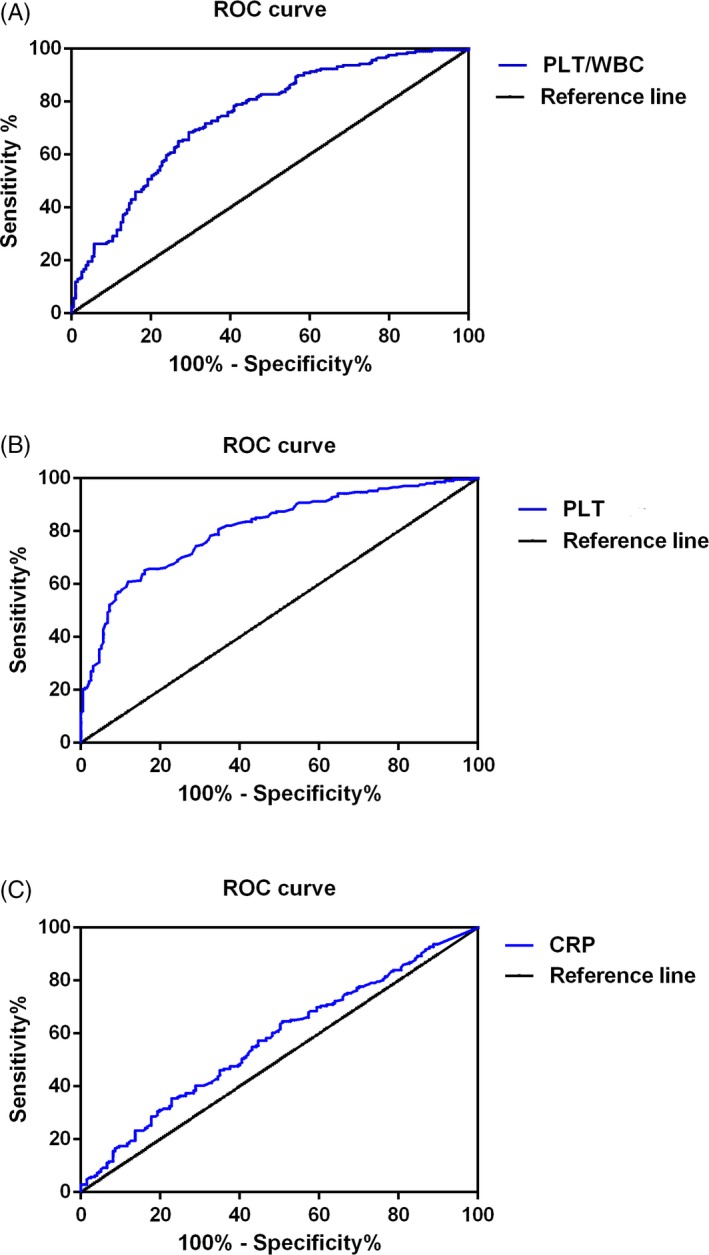
Results of the ROC curve analysis of (A) PLT count, (B) PLT/WBC, and (C) CRP. *P < 0.05, **P < 0.01, ***P < 0.001. CRP, C‐reactive protein; PLT, platelet; PLT/WBC, platelet‐to‐white blood cell ratio; ROC, receiver operating characteristic
Official websites use .gov
A
.gov website belongs to an official
government organization in the United States.
Secure .gov websites use HTTPS
A lock (
) or https:// means you've safely
connected to the .gov website. Share sensitive
information only on official, secure websites.
Results of the ROC curve analysis of (A) PLT count, (B) PLT/WBC, and (C) CRP. *P < 0.05, **P < 0.01, ***P < 0.001. CRP, C‐reactive protein; PLT, platelet; PLT/WBC, platelet‐to‐white blood cell ratio; ROC, receiver operating characteristic