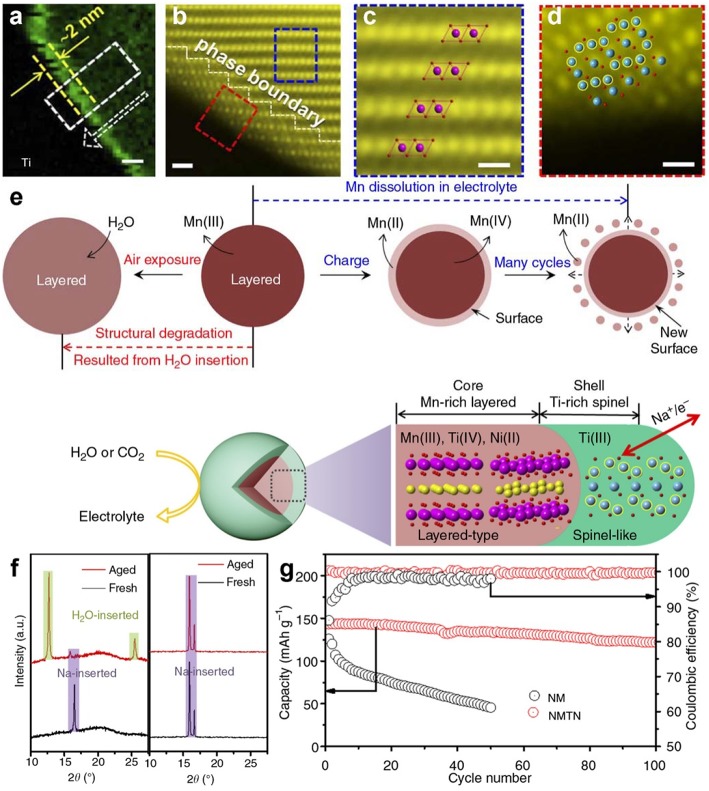
Figure 11.
(a) EELS chemical mapping of Ti element in NMTN sample, (b) STEM-HADDF image of NMTN sample, (c) Enlarged image extracted from the blue rectangle of part b, (d) Enlarged image extracted from the red rectangle of part b, (e) vulnerable mechanism of naked samples and protective mechanism of NMTN sample under moisture condition. (f) XRD patterns of naked sample (left) and NMTN sample (right) before/after air-exposure, (g) cycling performance of naked sample and NMTN sample. Reproduced with permission (Guo et al., 2017). Copyright 2017, Nature Publishing Group.

