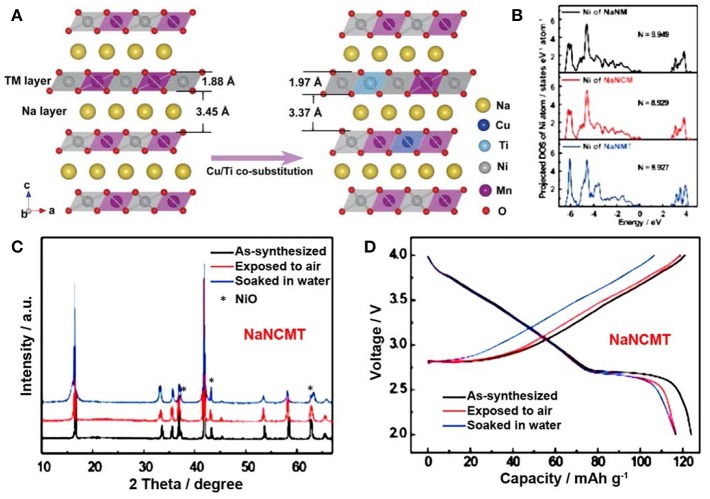
Figure 12.
(A) refined crystal structure of NaNM and NaNCMT samples, (B) Electronic density of states on Ni ion of NaNM, NaNCM, and NaNMT samples, respectively. (C) XRD patterns of pristine, air-exposure and water soaking NaNCMT samples. (D) charge/discharge curves of pristine, air-exposure and water soaking NaNCMT samples. Reproduced with permission (Yao et al., 2017). Copyright 2017, American Chemical Society.

