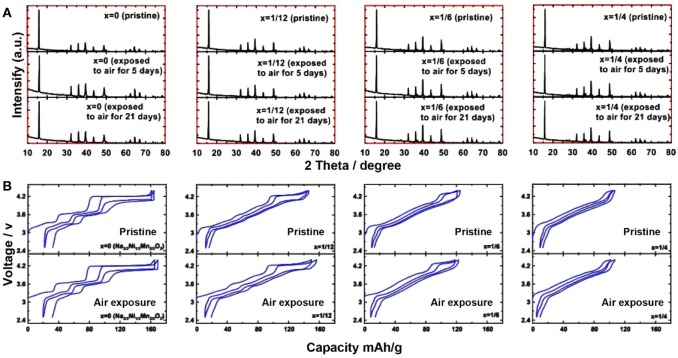
Figure 13.
(A) XRD patterns of Na2/3CuxNi1/3−xMn2/3O2 samples (x = 0, 1/12, 1/6 and 1/4) before/after air-exposure, (B) the corresponding charge/discharge profiles. Reproduced with permission (Zheng L. et al., 2017). Copyright 2017, American Chemical Society.

