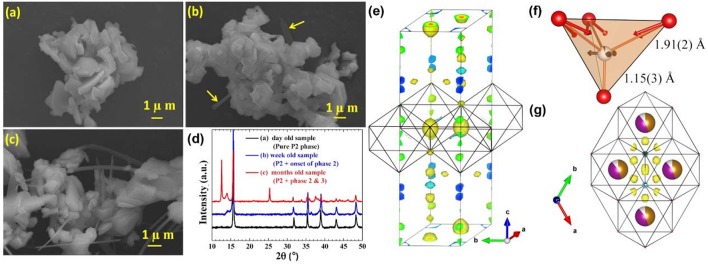
Figure 8.
(a) SEM images of Na0.67Mn0.5Fe0.5O2 after 1 day air-exposure, (b) Na0.67Mn0.5Fe0.5O2 after a couple of weeks' air-exposure, (c) Na0.67Mn0.5Fe0.5O2 after a couple of months' air-exposure, (d) XRD patterns of Na0.67Mn0.5Fe0.5O2 samples under different air-exposure time, (e) Nuclear Fourier difference map of Na0.67Mn0.5Fe0.5O2, (f) The local environment of CO, (g) The nuclear density around the carbon element position. Reproduced with permission (Duffort et al., 2015). Copyright 2015, American Chemical Society.

