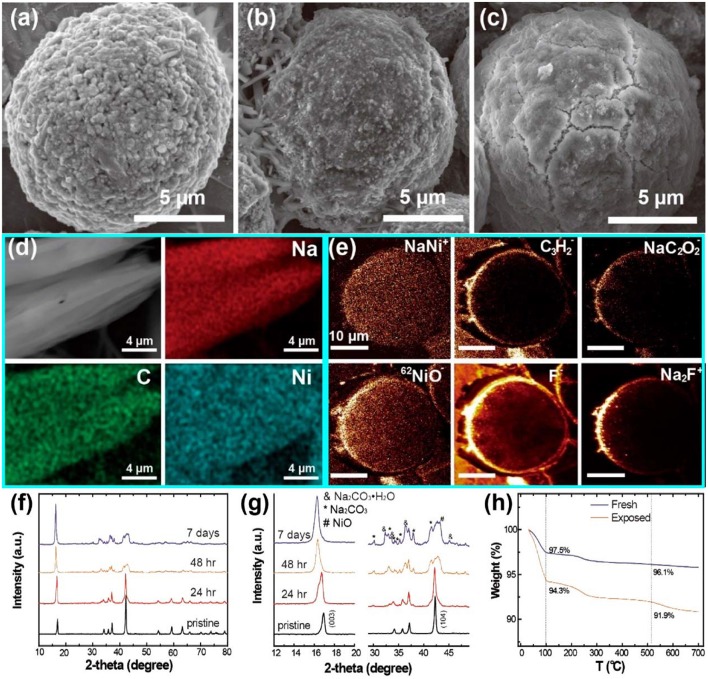
Figure 9.
SEM images of (a) pristine NaNi0.7Mn0.15Co0.15O2, (b) NaNi0.7Mn0.15Co0.15O2 after 24 h air-exposure, (c) NaNi0.7Mn0.15Co0.15O2 after 7 days air-exposure, (d) dendrite-like impurity in part b with the corresponding elemental mappings of Na, C and Ni, (e) TOF-SIMS chemical mapping of NaNi0.7Mn0.15Co0.15O2 after 24 h exposure, (f) XRD patterns of NaNi0.7Mn0.15Co0.15O2 samples under different air exposed time, (g) the enlarged peaks from part f, (h) TGA profiles of pristine NaNi0.7Mn0.15Co0.15O2 and 7 days exposed NaNi0.7Mn0.15Co0.15O2 samples. Reproduced with permission (You et al., 2018). Copyright 2018, American Chemical Society.

