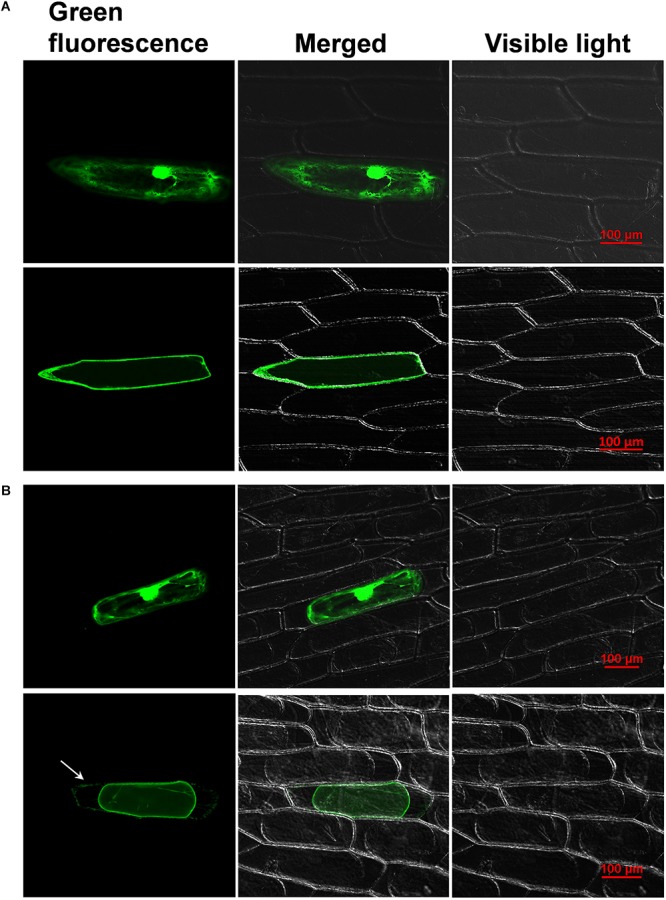
FIGURE 1.

Fluorescence microscopy images of (A) normal and (B) plasmolyzed onion epidermal cells transiently expressing either free green fluorescent protein (GFP) (top) or 35S: CaWAKL20-GFP fusion proteins (bottom). The arrow shows the GFP signal at the cell wall. Scale bar = 100 μm.
