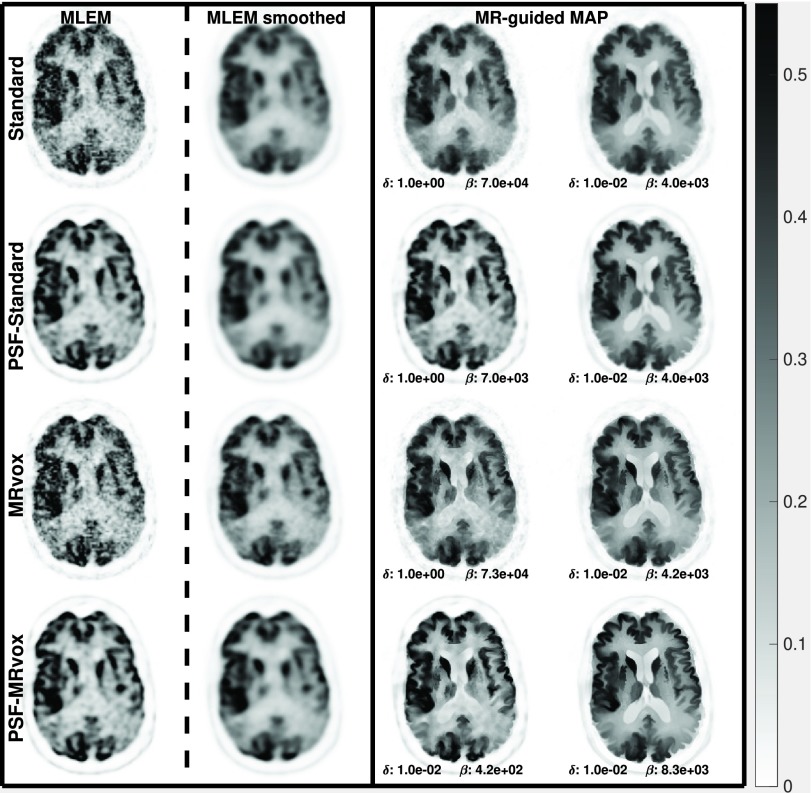
Fig. 13.
MLEM, MR-guided MAP, and MR-guided MAP with PSF modeling reconstructed images for standard and MR voxel sizes at iteration number 400 for the real data study. MLEM reconstructed images as performed in clinical routine are also presented in the MLEM smoothed column. The color scale is in arbitrary units.

