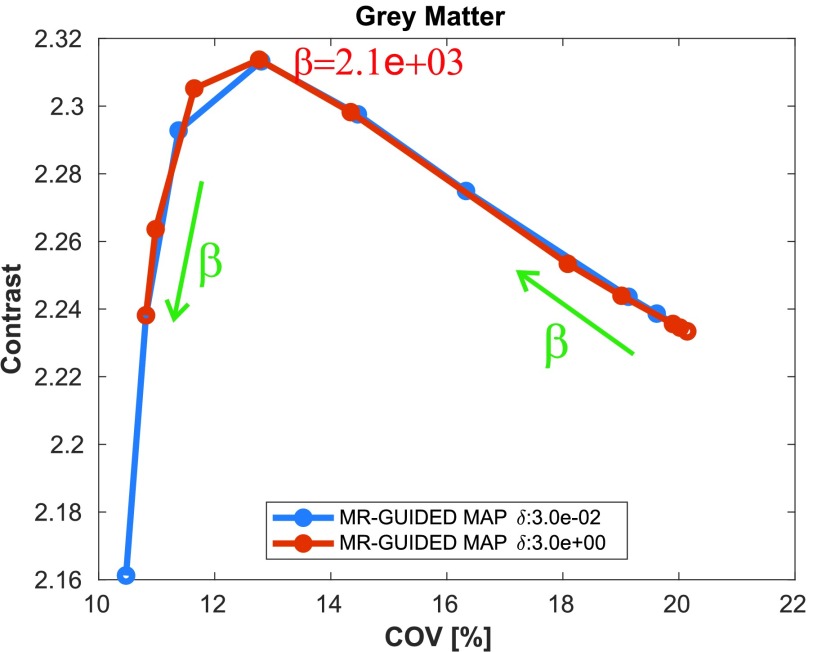
Fig. 7.
Contrast versus COV in the cortical gray matter as a function of the regularization hyperparameter  for two different
  values for MR-guided MAP reconstruction with PSF modeling and standard voxel sizes. All the images were evaluated at iteration number 400. The
  value grows in the direction of the green row and the
  value for maximum contrast is in red text. The true contrast in the phantom was 4.

