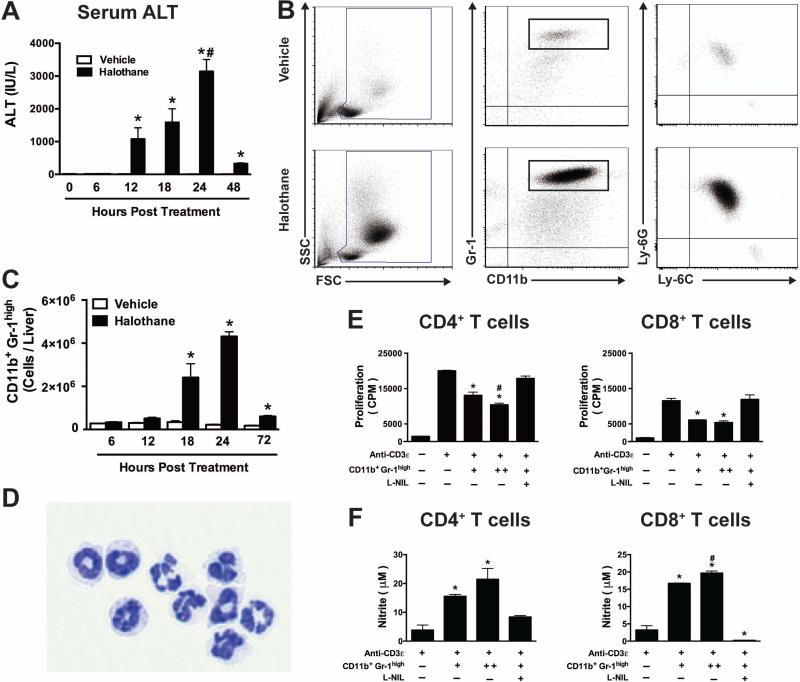
Figure 1. Halothane-induced liver injury in mice is associated with hepatic infiltration of CD11b+Gr-1high cells that suppress T cell proliferation.
(A) Female Balb/cJ mice were injected IP with halothane (30 mmol/kg) or vehicle (olive oil), and serum ALT activities were determined at 6, 12, 18, 24 and 48 hours post-treatment with N=5 mice per group. *P<0.05 versus vehicle-treated control group at the same time point; #P<0.05 versus other time points within the same treatment. (B) Mice were injected with halothane or vehicle and at 24 hours post-treatment hepatic leukocytes were isolated and analyzed by flow cytometry. Representative density dot plots (Left panels) show the SSC- and FSC-area to demonstrate size and granularity of total hepatic leukocytes from individual mice. Middle panels show representative Gr-1 and CD11b staining and CD11b+ Gr-1high cells were then gated and analyzed for Ly-6G and Ly6C staining (Right panels). (C) The total numbers of hepatic CD11b+Gr-1high cells per liver were determined by flow cytometry at 6, 12, 18, 24 and 72 hours post halothane or vehicle treatment with N=4-8 per group. *P<0.05 compared with vehicle-treated group at the same time point. (D) CD11b+ Gr-1high cells were sorted by flow cytometry 24 hours post halothane treatment and visualized by light microscopy on slides following cytospin preparation and DiffQuik staining. (E) CD4+ and CD8+ T cells purified from spleens of naïve mice by cell sorting were incubated with TCR stimulation (anti-CD3ε antibody) along with splenic antigen presenting cells and CD11b+ Gr1high cells isolated from halothane treated mice at equivalent (+) or 2 fold levels (++) with or without L-NIL. Cells were cultured for 96 hours and proliferation was measured by [3H]-thymidine incorporation during the last 24 hours of incubation. (F) NO production was measured in the culture supernatant obtained from the above mentioned experiment where CD4+ T cells or CD8+ T cells were co-cultured with CD11b+, Gr1high cells from halothane treated mice at equivalent (+) or 2-fold levels (++) with or without L-NIL for 72 hours. Data reported is comprised of N=2 experimental replicates per group and is representative of similar results from three independent experiments. *P<0.05 versus anti-CD3ε alone or in the presence of CD11b+ Gr-1high cells and L-NIL; #P<0.05 versus [1:1] MDSC ratio group. All data reported as mean ± SEM.

