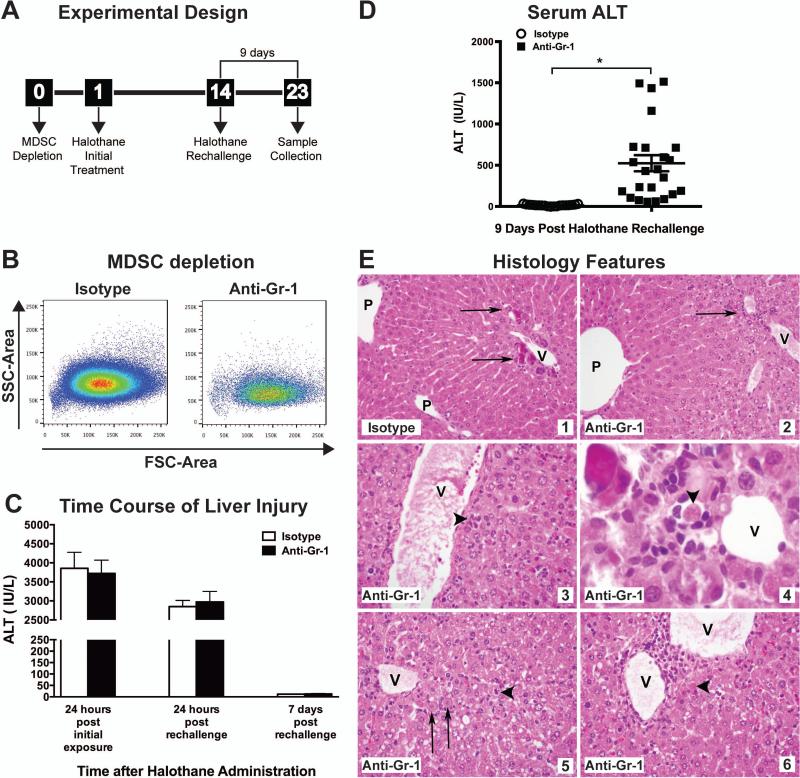
Figure 2. Procedure for inducing an adaptive immune response against TFAPA released from damaged hepatocytes.
(A) Experimental design: 24 hours prior to the initial halothane treatment, mice were administered either 20 μg/mouse of isotype control antibody or Anti-Gr-1 to deplete MDSCs. Mice were rechallenged with halothane on day 14 and monitored for development of liver injury. (B) Representative dot plots of hepatic MDSCs (SSChigh, CD11b+, Gr-1high) isolated from isotype control or anti-Gr-1 treated mice 24 hours post initial halothane treatment. (C) Mice were injected on Day 0 with Anti-Gr-1 or isotype control antibody. After 24 hours (Day 1), the mice were administered halothane dissolved in olive oil. Serum ALT activity was determined 24 hours post initial halothane exposure. On day 14, mice were rechallenged with halothane and serum ALT activity was determined 24 hours and 7 days following rechallenge. (D) Serum ALT activities were determined at 9 days post halothane rechallenge in isotype or anti-Gr-1 treated mice. Data reported as means ± SEM of 19-23 mice per group from 3 independent experiments. *P<0.05 versus isotype-treated group. Each symbol represents data from an individual mouse. (E) Representative photomicrographs of H&E stained liver sections from mice at 9 days after halothane rechallenge. For all panels, central veins (V) and portal areas (P) are indicated. (Inset 1) Isotype-treated mouse liver showing perivenular microcalcifications (arrows) but no inflammation or evidence of cytopathic injury (H&E, 400x). (Inset 2) Anti-Gr-1 treated mouse liver showing mild perivenular lymphocytic inflammation (arrow) (ALT: 712 IU/L). (H&E, 400x). (Inset 3) Perivenular region showing multiple small foci of inflammation including a small cluster of plasma cells in anti-Gr-1 treated mouse liver (arrowhead) (H&E, 400x). (Inset 4) In an anti-Gr-1 treated mouse liver, hepatocyte dropout and apoptosis was observed and an apoptotic hepatocyte (arrowhead) is surrounded by small lymphocytes and macrophages. (H&E, 600x original magnification). (Inset 5&6) Anti-Gr-1 treated mouse liver shows inflammation, necrosis and apoptosis in zone 3. Necrotic hepatocytes (arrows) have preserved cell size but ghost nuclei and are found mainly near the veins. Apoptotic hepatocytes (arrowheads) were scattered around the edges of the injury (ALT: 1513 IU/L). (H&E, 400x).

