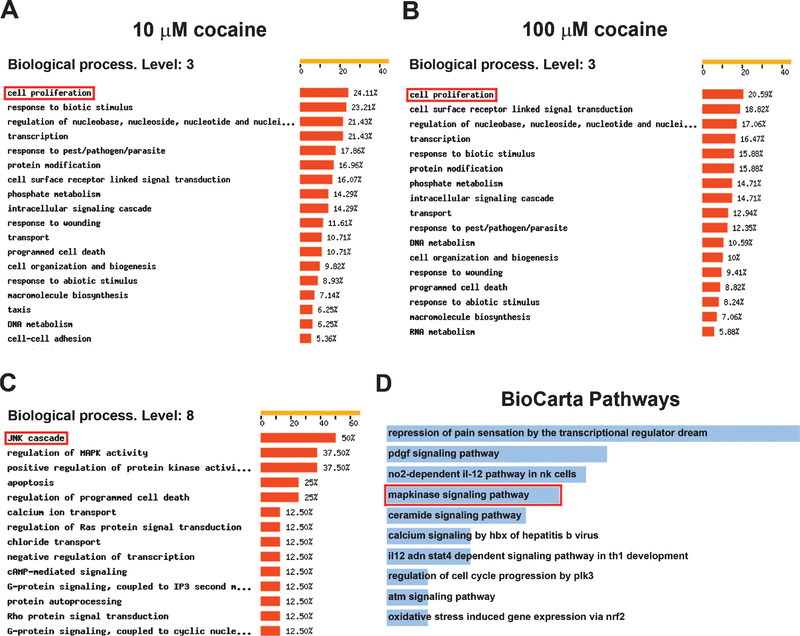
Fig. 2.
Functional breakdown of microarray-identified genes which showed significant changes after cocaine treatment. (A-C) FatiGO was employed to extract Gene Ontology (GO) terms from the transcripts changed by cocaine. (A) 40 transcripts changed by 10μM cocaine categorized at biological process level 3. (B) 88 transcripts changed by 100 μM cocaine categorized at biological process level 3. (C) 95 transcripts changed by either 10 or 100 μM cocaine categorized at biological process level 8. Percentages relate to total number of genes changed by cocaine with an ontology at each biological process level. Only categories > 5% of total number of transcripts changed by cocaine are shown. (D) Pathway enrichment analysis on the BioCarta database was employed to identify signal transduction pathways from 95 transcripts changed by either 10 or 100 μM cocaine. The red rectangles indicate the potential gene ontology categories or signal transduction pathways affected by cocaine that were selected for further analysis.

