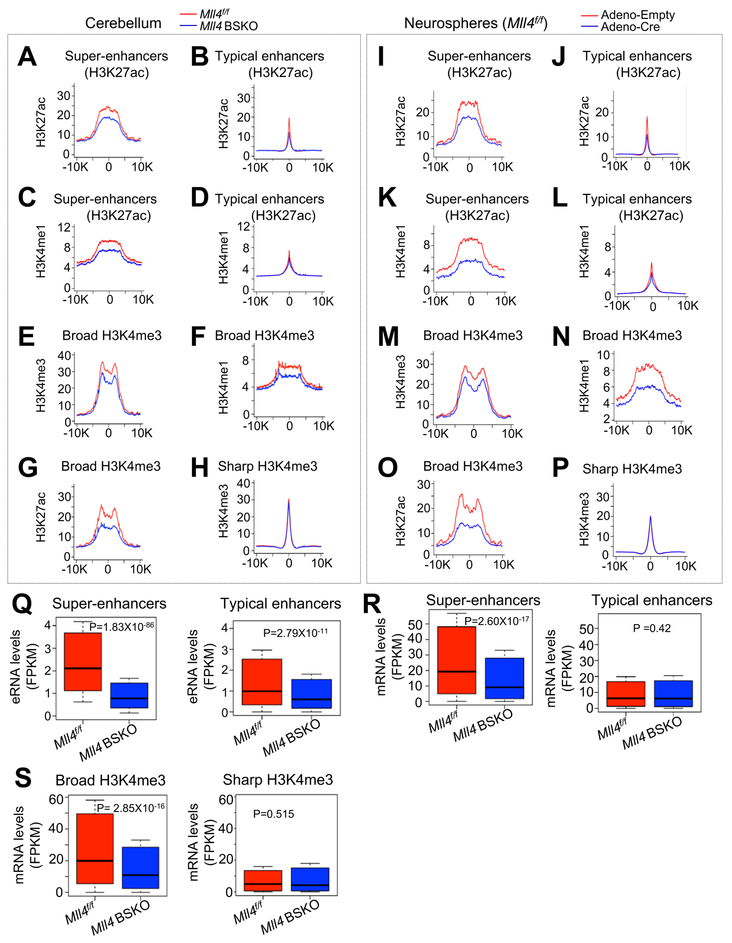
Figure 6. Mll4 Loss Results in Genome-wide Impairment of Broad H3K4me3 and Super-enhancers.
(A ‒ D) Average ChIP-seq read densities for H3K27ac (A and B) and H3K4me1 (C and D) at super-enhancers (A and C) and all typical enhancers (B and D) in 4-month-old Mll4f/f and Mll4 BSKO cerebella. Enhancers were defined using H3K27ac signals.
(E ‒ H) Average ChIP-seq read densities for H3K4me3 (E), H3K4me1 (F), and H3K27ac (G) at broad H3K4me3 regions and for H3K4me3 (H) at sharp H3K4me3 regions in 4-month-old Mll4f/f and Mll4 BSKO cerebella.
(I ‒ L) Average ChIP-seq read densities for H3K27ac (I and J) and H3K4me1 (K and L) at super-enhancers (I and K) and all typical enhancers (J and L) in cerebellar neurospheres treated with Adeno-empty or Adeno-Cre. Enhancers were defined using H3K27ac signals.
(M ‒ P) Average ChIP-seq read densities for H3K4me3 (M), H3K4me1 (N), and H3K27ac (O) at broad H3K4me3 regions and for H3K4me3 (P) at sharp H3K4me3 regions in cerebellar neurospheres treated with Adeno-Empty or Adeno-Cre.
(Q) Boxplots showing eRNA levels (Fragments Per Kilobase of transcript per Million mapped reads; FPKM) from super-enhancers and typical enhancers in Mll4f/f and Mll4 BSKO cerebella (4-month-old).
(R and S) Comparison of mRNA levels (FPKM) of genes associated with super-enhancers (R), typical enhancers (R), broad H3K4me3 (S), and sharp H3K4me3 (S) between Mll4f/f and Mll4 BSKO cerebella (4-month-old).
For A‒H and I‒P, average profiles of two ChIP-seq data was used to generate individual density plots, and horizontal axis represents a region from −10 kb to +10 kb with the respect to the center. For comparison in Q‒S, 1,000 genes were used for typical enhancers and sharp H3K4me3. The p values were calculated using the Wilcoxon signed rank test.
See also Figures S4 and S5.

