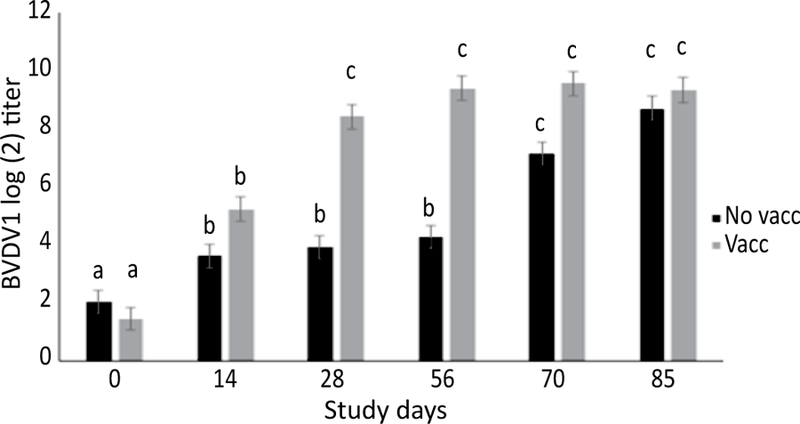
Figure 8.

Model adjusted BVDV1 titer concentrations in calves vaccinated (n=40, 10 pens) and not vaccinated (n=40, 10 pens) at arrival (d 0) from a linear regression model. All calves received vaccine on d 56. The BVDV1 SN titers increased for both treatment groups at d 14. Vaccinated calves averaged 4.5 2-fold dilutions higher BVDV1 SN titers at d 28 and 5.1 2-fold dilutions higher BVDV1 SN titers at d 56 compared to non-vaccinated calves. Calves receiving their first dose of vaccine on d 56 had an increase in BVDV1 titers at d 70 and d 85 to levels comparable to previously vaccinated calves. Error bars represent 1 standard error. Different superscripts indicate a statistically significant difference between variables (α=0.05).
