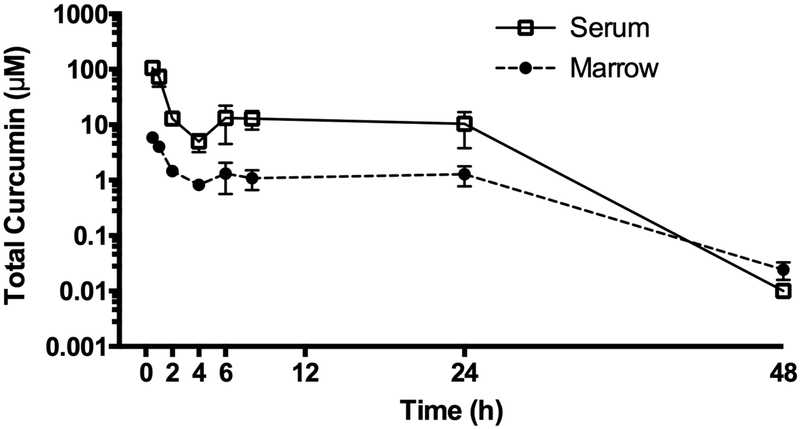
Figure 2. Pharmacokinetics of total curcumin in serum and marrow after acute curcumin treatment.
Total curcumin levels (sum of aglycone and glucuronidated curcumin) in serum (□) and marrow (●) were determined by LC/MS after oral gavage with 500 mg/kg curcumin in female 4-week C57BL/6J mice at the indicated times. Data expressed as mean ± SEM (n=4/group).

