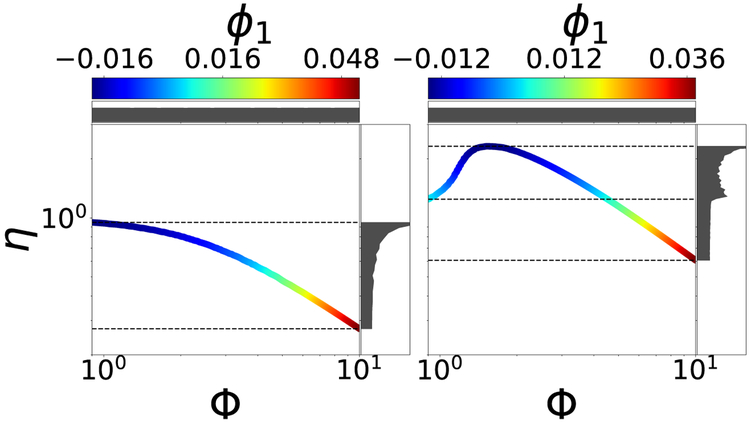
Figure 9:
Left: Output η, vs. input Φ for the isothermal catalyst pellet (β = 0.0, see SI) colored by ϕ1. Right: Same plot for a nonisothermal (β = 0.2) pellet. For uniform input Φ sampling, the observed output pdf’s (see text) are plotted alongside each panel. Using output-only informed DMAPS is unable, as the coloring shows, to accurately parameterize the noninvertible case: Widely different sections of the curve on the right take on the same color. Note also the discontinuity in the density along the η axis in the right figure, a hallmark of noninvertibility.

