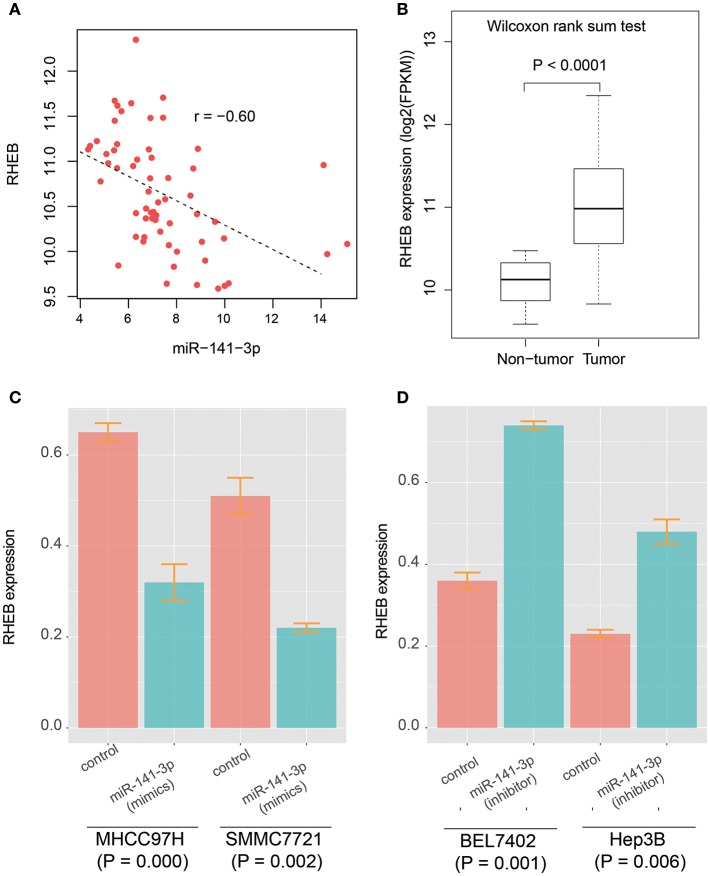
Figure 2.
The prediction and validation of miR-141-3p binding with RHEB mRNA. (A) The RNA expression correlation between circRNA-100338 and RHEB. Each point in the scatterplot represents one sample. The expression of both RHEB and miR-141-3p are normalized and logarithm-transformed. Spearman correlation coefficient is used to identify the reverse expression correlation. (B) RHEB expression patterns in HCC tumor and non-tumor tissues. (C,D) RHEB expression in untreated and treated HCC cell lines by miRNA mimics or inhibitors.

