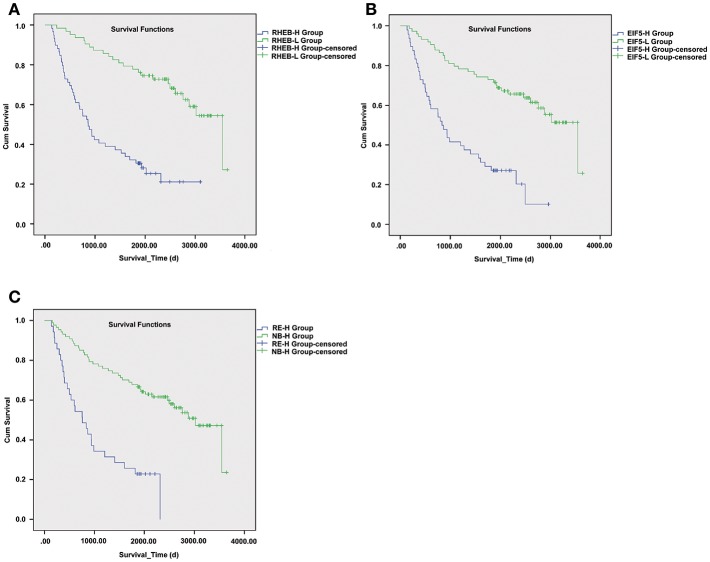
Figure 6.
The survival differences between samples with one or both of RHEB and EIF5 elevated expression. The Kaplan–Meier (KM) curves for samples with high (RHEB-H or EIF5-H group) and low (RHEB-L or EIF5-L group) expression of RHEB or EIF5 are illustrated in (A) and (B), respectively. (C) The KM curves represent the samples in high expression of both RHEB and EIF5 (RE-H group) and those in low expression of one of the two proteins (RE-L group). The survival analysis indicates the prognostic values of RHEB and EIF5 in HCC.

