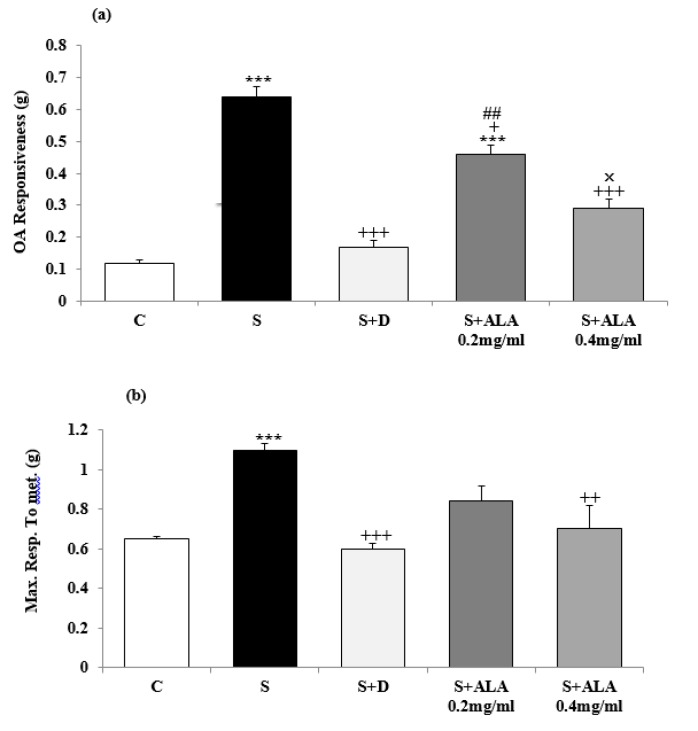
Figure 6.
Values (mean±SEM) of maximum response to methacholine (a) and tracheal response to ovalbumin (b) in control rats (C), sensitized animals (S), S treated with dexamethasone (S+D) and two concentrations of alpha linolenic acid (S+ALA), (n=4 for ALA and n=6 for other groups).
Statistical differences between groups S, S+D and S+ALA versus group C; *** P<0.001
Statistical differences between groups S+D and S+ALA versus group S; + P<0.05, ++ P<0.01, +++ P<0.001.
Statistical differences between groups S+ALA versus group S+D; ## P<0.01
Statistical differences between groups S+ALA 0.2 mg/ml versus S+ALA 0.4 mg/ml; × P<0.05
The statistical comparisons were made using one way analysis of variance (ANOVA) with Tukey-Kramer’s post-test

