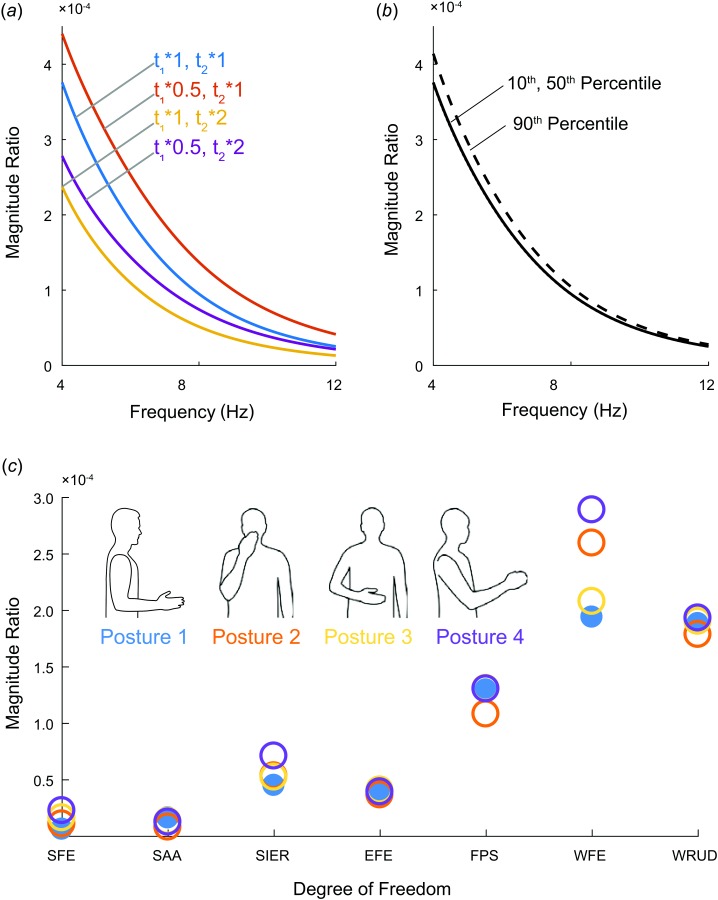
Fig. 10.

Results of sensitivity analysis: (a) Effect of varying muscle time constants t1 and t2, (b) effect of changing moment arms from default model (50th percentile male) to 10th or 90th percentile male. The line of the 10th percentile male is nearly indistinguishable from the 50th percentile male. (c) Changes to total summed magnitude ratio at 8 Hz for each DOF for different postures. The units of the magnitude ratio are rad/a.u. (see caption of Fig. 6).
