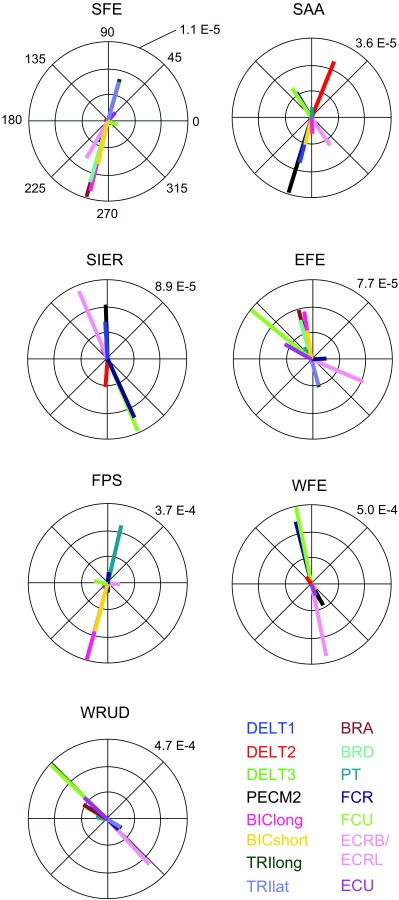
Fig. 7.

Phasor plot of the frequency response at 8 Hz (middle of the tremor band), grouped by output DOF (listed above each subplot) and color coded by input muscle. The numeric value on each subplot indicates the radius of the outer circle (in rad/a.u.; see caption of Fig. 6).
