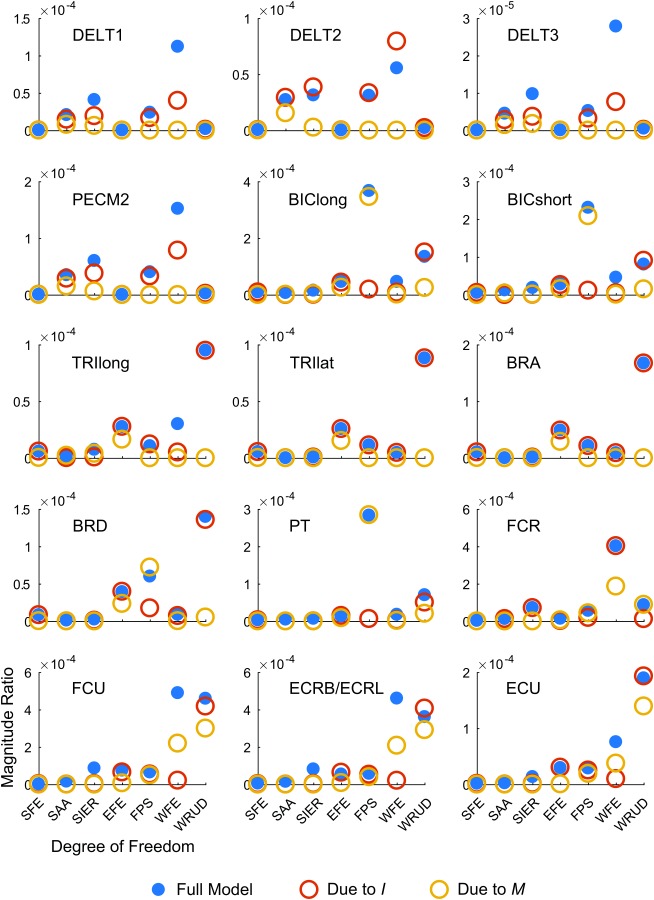
Fig. 9.

Coupling analysis. Each subplot shows the magnitude ratio at 8 Hz (middle of tremor band) for a given input muscle (listed in each subplot), listed by output DOF (horizontal axis) for the default model (solid blue circles), a model with coupling due to inertia but not moment arms (, empty red circles), and a model with coupling due to moment arms but not inertia (, empty yellow circles). For the majority of input–output cases, spreading due to inertia only (red) is more similar to the full model than spreading due to moment arms only (yellow), indicating that inertia spreads tremor more than musculoskeletal geometry (i.e., moment arms). The units of the magnitude ratio are rad/a.u. (see caption of Fig. 6).
