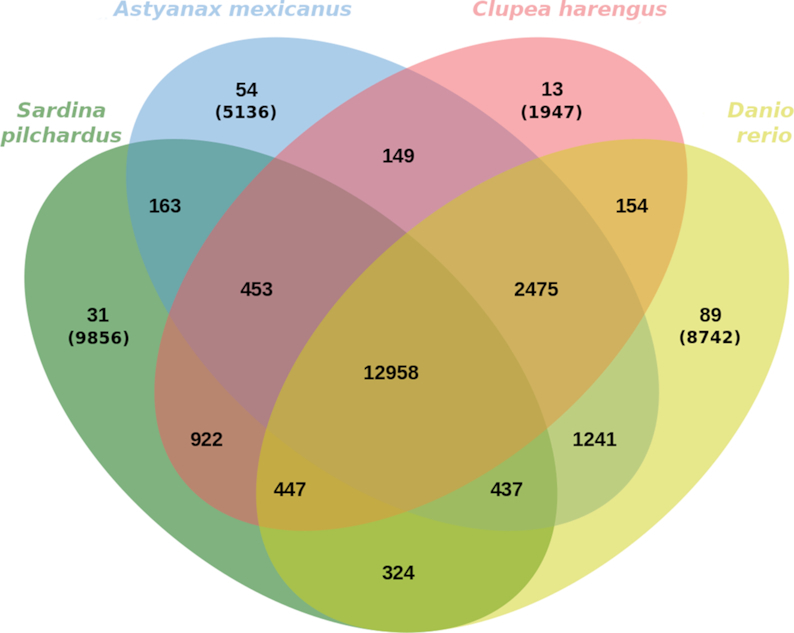
Figure 3:

Venn diagram representing paralogous and orthologous groups between sardine (S. pilchardus), blind cave fish (A. mexicanus), zebrafish (D. rerio), and herring (C. harengus) obtained with OrthoFinder and plotted with Jvenn [40]. Orthogroups of singleton genes are showed in parentheses.
