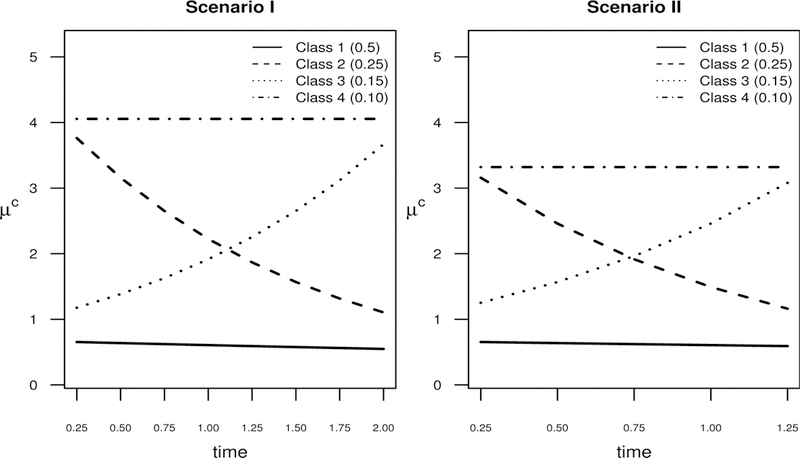
FIGURE 1.

Mean latent trajectories µc (t ) for the two central simulation scenarios. In Scenario I, observations for each subject are made at each of the eight time points ti j = j /4, j = 1, … , 8, and in Scenario II, observations for each subject are made at each of the five time points ti j = j /4, j = 1, … , 5. For both scenarios, the class-membership proportions are as follows: Class 1: 50%, Class 2: 25%, Class 3: 15%, and Class 4: 10%.
