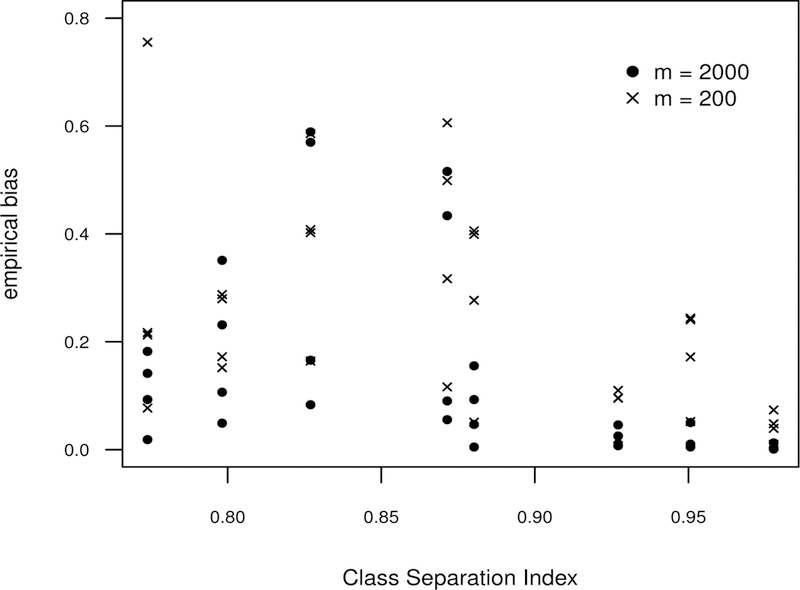
FIGURE 2.

Average absolute empirical bias for the latent trajectories using data simulated under the eight simulation settings of the INAR(1)-NB model. For each simulation setting and number of subjects, empirical bias is calculated for each of the four latent classes. For each latent class, bias is calculated as , where is the average estimate of µc (t j ) (average over simulation replications) and µc (t j ) is the true value of the mean curve at time t j. Absolute empirical bias values are plotted versus the class separation index (CSI) of the associated simulation settings. The values of the empirical bias were obtained using 200 replications for each of the eight scenarios and each choice of the number of subjects (either m = 200 or m = 2, 000).
