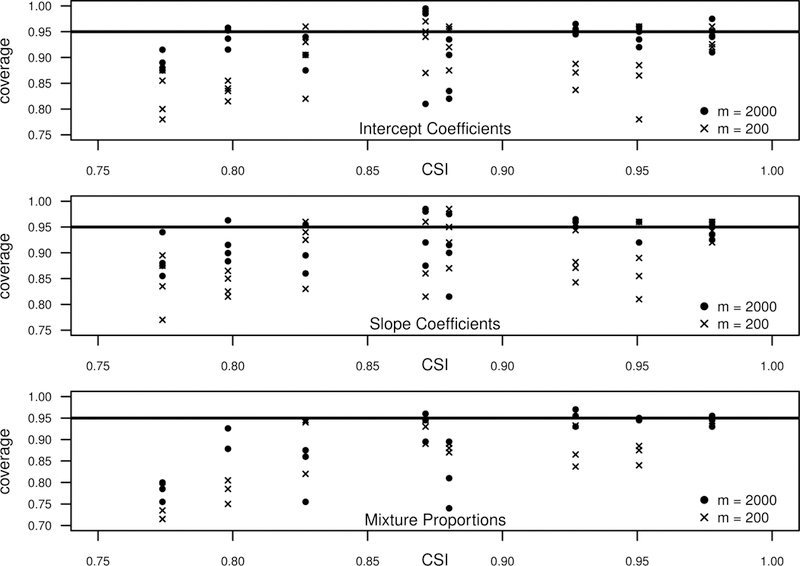
FIGURE 3.

Coverage proportions (using 95% confidence intervals) for the regression parameters (both the intercept and slope) and mixture proportions using data simulated under the eight simulation settings of the INAR(1)-NB model. Empirical coverage proportions are plotted versus the associated class separation index (CSI) of the associated simulation settings. Coverage proportions are shown for simulations with m = 200 subjects and m = 2, 000 subjects.
