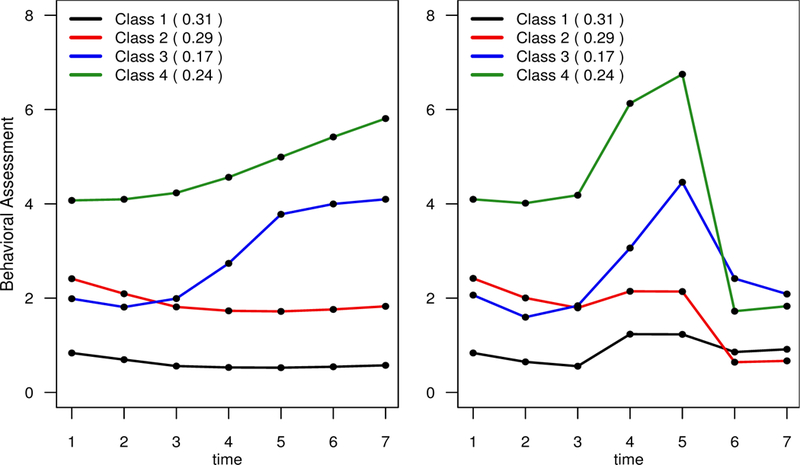
FIGURE 5.

Estimated trajectories for the CNLSY data assuming four latent classes. The terms in parentheses represent estimated class-membership proportions. The left panel displays the estimated trajectories adjusted for the different measurement scales used at different time points; these can be thought of as the fitted latent trajectories on the mother-reported BPI measurement scale. More specifically, the fitted curves in the left panel do not include the time indicators present in equation (8) while the right-hand panel displays the fitted trajectories associated with the full model in equation (8).
