
FIGURE 6.
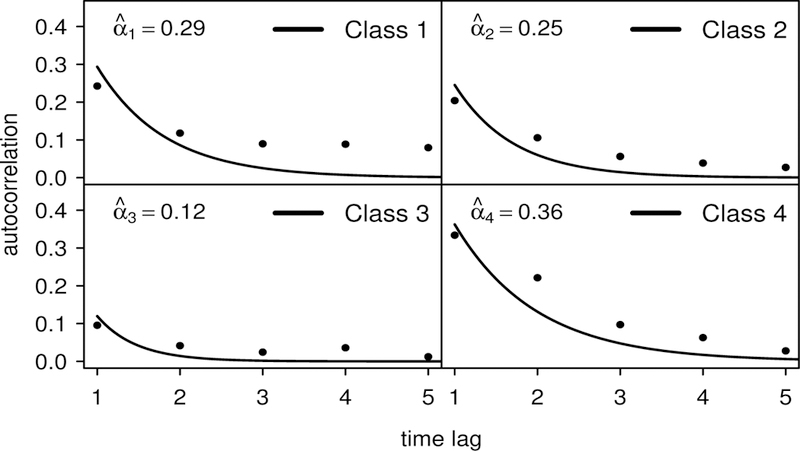
ECNLSY data: estimated class-specific autocorrelation functions and sample autocorrelation values (weighted) obtained by using the estimated posterior probabilities of class membership to randomly assign each subject to one of the four latent classes. The random assignment procedure was repeated 1, 000 times; the displayed autocorrelation values (i.e., the points in the figure) represent the average autocorrelation values from these replications. The solid lines represent the estimated class-specific estimated AR(1) autocorrelation functions from the four-class model.