
Figure 1. Elastic Net Plots Generated in GLMNET.
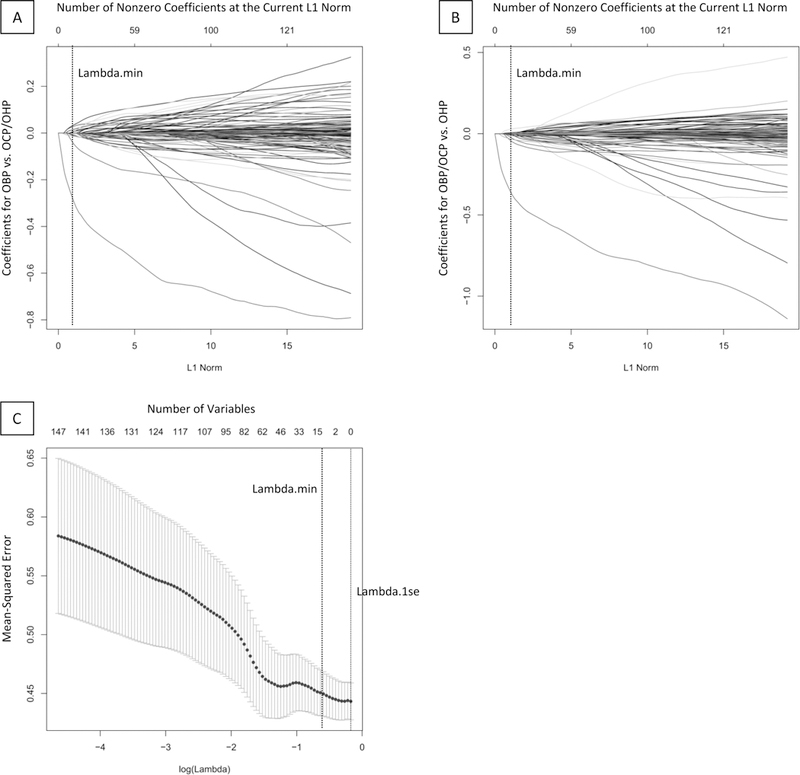
A-B. Plots of variable fit for BD risk group (OBP versus OCP and OHP, A) and general risk group (OBP and OCP versus OHP, B). Each curve corresponds to an independent variable in the full model prior to optimization. Curves indicate the path of each variable coefficient as λ varies. Lambda.min (λ=0.553) corresponds to the λ which corresponds to the selected model with 12 predictor variables. C. Plot of non-zero variable fit after cross validation. Representation of the 10-fold cross validation performed for the elastic net regression that chooses the optimal λ. Lambda.min corresponds to the λ which minimizes mean squared error. Lambda.1se corresponds to the λ that is one standard error from the lambda.min.
Abbreviations: Bipolar Disorder (BD); Offspring of Bipolar Parents (OBP); Offspring of Comparison Parents (OCP); Offspring of Healthy Parents (OHP).