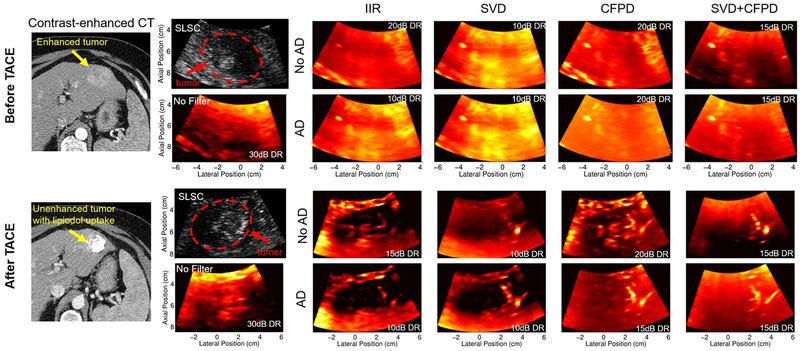
Fig. 12.
Gold-standard contrast-enhanced CT, anatomical SLSC and power Doppler images before (top) and after (bottom) TACE. Post-treatment CT and ultrasound were acquired 2 months and immediately after TACE, respectively. Power Doppler images are shown for each combination of adaptive demodulation (AD), SVD, and CFPD as well as for baseline IIR filtering and no tissue filtering. Dynamic ranges (DR) are displayed on each power Doppler image and were chosen to ensure qualitatively similar noise floors.

