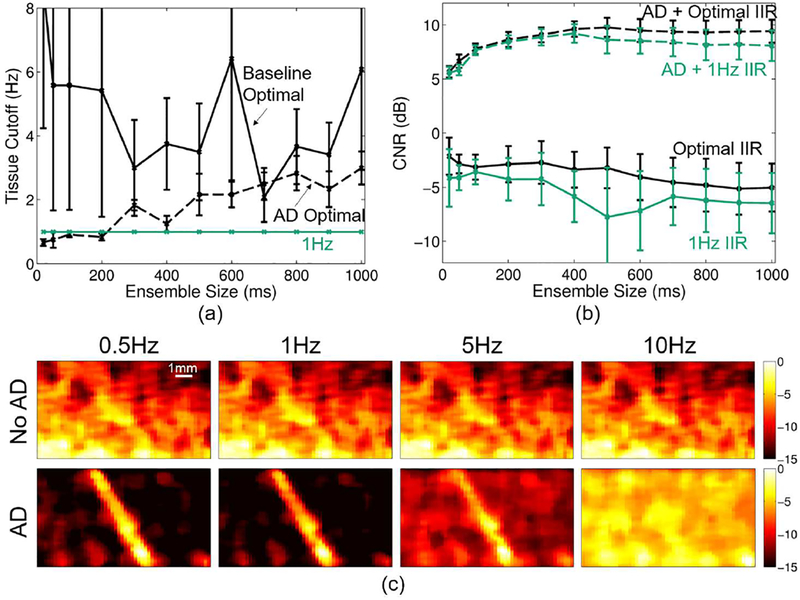
Fig. 7.
(a) Average optimal IIR cutoff (± standard error) (black) vs. ensemble size for baseline (solid) and adaptively demodulated (AD) data (dashed). 1Hz cutoff is shown in teal. (b) Average CNR (± standard error) obtained with optimal cutoff (black) and with a 1Hz cutoff (teal) vs. ensemble size for baseline (solid) and AD (dashed). (c) Baseline (top) and AD (bottom) power Doppler images for a single realization made using a 400ms ensemble size and conventional high-pass IIR filter with the following cutoffs (imaged from left to right): 0.5, 1, 5, and 10Hz. Images are on a dB scale.

