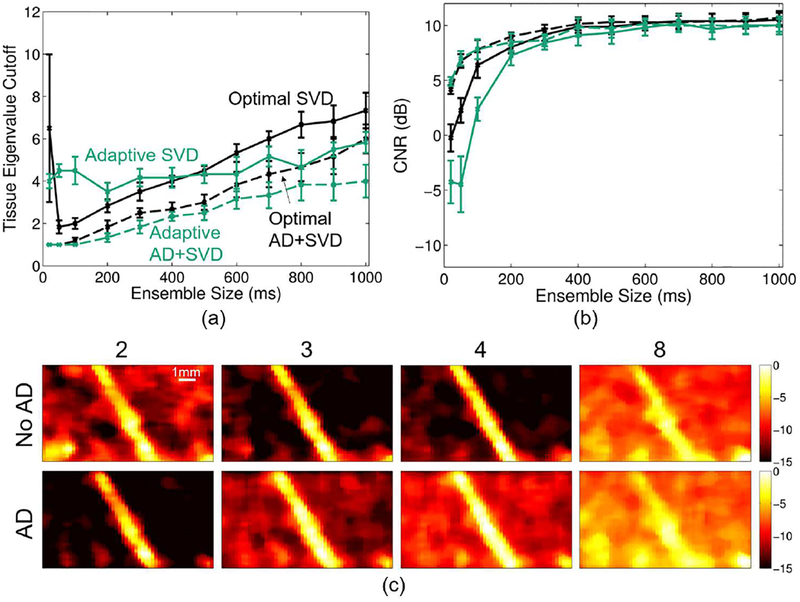
Fig. 8.
(a) Optimal (black) and adaptive (teal) SVD average tissue cutoff (± standard error) vs. ensemble size for baseline (solid) and adaptively demodulated (AD) data (dashed). (b) Average CNR (± standard error) obtained with optimal (black) and adaptively selected (teal) cutoffs vs. ensemble size for baseline (solid) and AD data (dashed). (c) Baseline (top) and AD (bottom) power Doppler images for a single realization made using a 400ms ensemble size and SVD filter (without noise filtering) with the following tissue eigenvalue cutoffs (imaged from left to right): 2, 3, 4, and 8. Images are on a dB scale.

