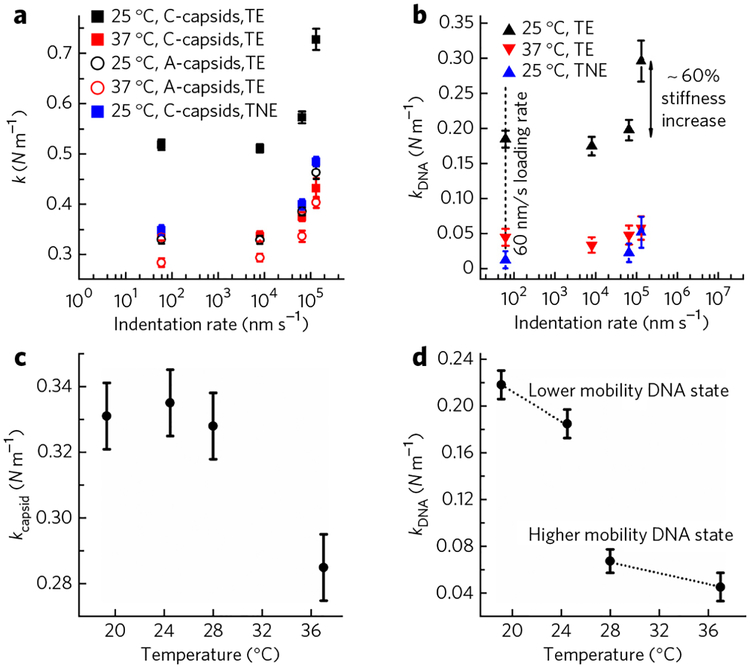
Figure 3 |. Solid-to-fluid like DNA transition inside the HSV-1 capsid close to the temperature of infection.
(a) Spring constants of HSV-1 C- and A-capsids as a function of indentation rates at 24 °C and 37 °C in low-salt TE buffer. We also performed measurements in high-salt TNE buffer at 24 °C. Note that the A-capsid spring constants are the same in both TE- and TNE buffers. The error bars show the s.e. (b) Spring constants of encapsidated DNA obtained from subtracting spring constants for A-capsids from that of C-capsids at each indentation rate. k(DNA) is shown at 24 °C and 37 °C in low-salt TE buffer and at 24 °C in high-salt TNE buffer. The error bars show s.e. The dashed line shows the indentation rate of 60 nm s−1, at which the DNA relaxation rate during the indentation is faster than the AFM tip indentation rate (i.e., indentation occurs at equilibrium). (c) Spring constants for HSV-1 A-capsid in TE buffer as a function of temperature. (d) Spring constants for encapsidated DNA alone in C-capsid in TE buffer as a function of temperature. kDNA is derived by subtracting the spring constant for A-capsid from that of the C-capsid. Forty to sixty force-distance curves were analyzed for each case. The Gaussian curve fitting to the distribution of the spring constants yields the s.d., which is converted to the s.e. The error bars show the s.e.

