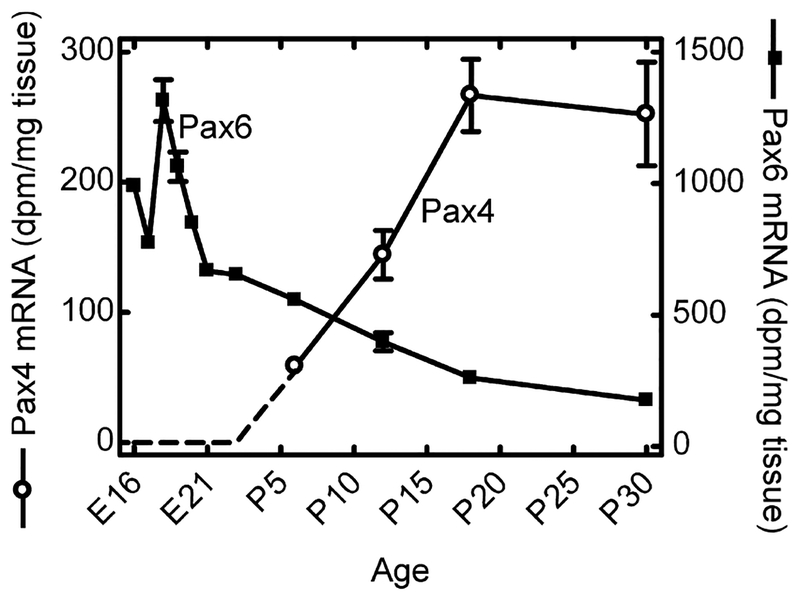
Fig. 3.
Densitometric quantification of in situ hybridization autoradiographs of ontogenetic Pax4 and Pax6 gene expression in the rat retina. In the earliest stages, a Pax4 signal above background was not detected (dotted line). Values on graphs represent the mean ± SEM of three animals at each developmental stage examined. Significant differences in Pax4 mRNA levels occurred during development (one-way ANOVA, F3,8 = 14.2, p = 0.0015) with maximal levels detected at postnatal day 18 (P18) and P30 (Tukey’s multiple comparison test, p-values < 0.05). Significant differences in Pax6 mRNA levels during development were also detected (one-way ANOVA, F10,21 = 130.8, p < 0.0001) with maximal levels obtained at embryonic day 18 (E18) (Tukey’s multiple comparison test, p-values < 0.001).

