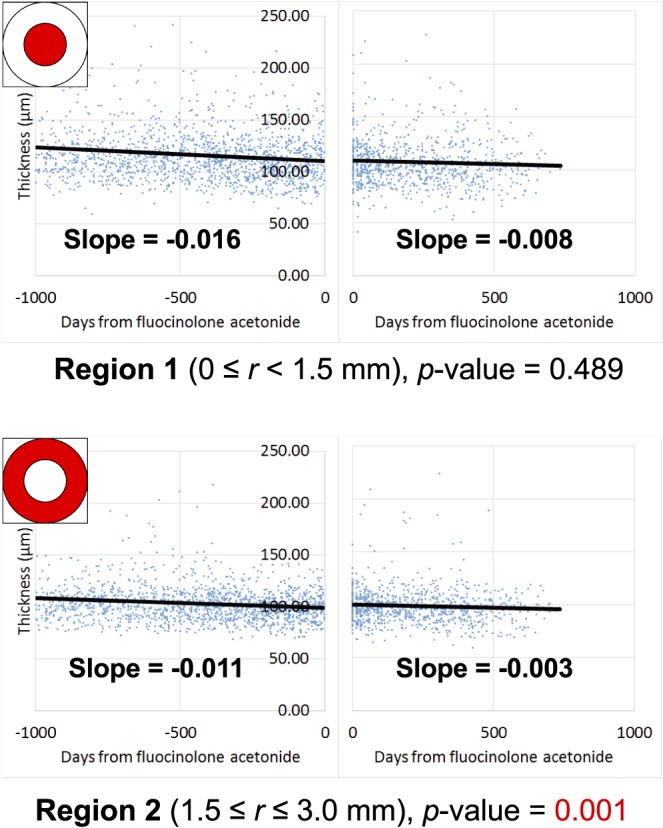
Figure 2.

For all subjects at all time points, the inner neuroretinal thickness (defined as the sum of the NFL, GCL, and IPL thicknesses) is shown on the y-axis and time is shown on the x-axis, where t = 0 days at the time of FAc treatment. Results for region 1 are shown in the top half of the figure and for region 2 in the bottom half of the figure. Calculation of slope is corrected for age, sex, imaging platform (i.e., Zeiss versus Heidelberg), and lens status. The value of the slope represents the average adjusted inner neuroretinal loss per day.
