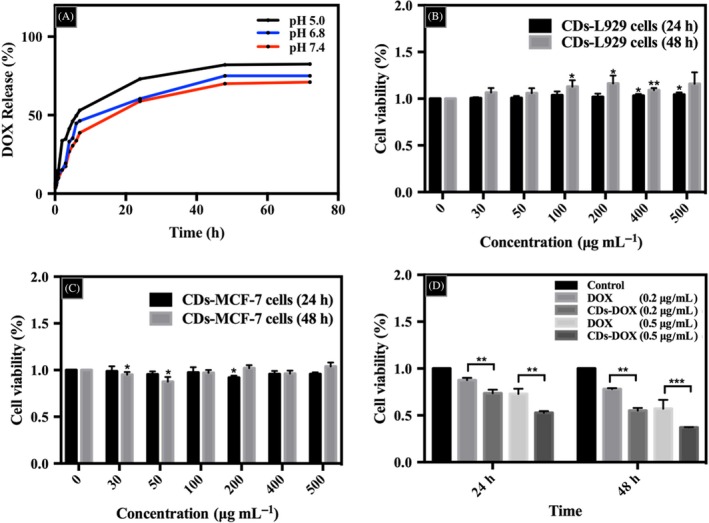
Figure 3.

The drug release curves and cytotoxicity study. A, pH‐responsive release of delivery of doxorubicin (DOX) from CDs‐DOX in PBS at pH 5.0, 6.8 and 7.4. Cytotoxic effects of carbon dots (CDs) on L929 cells (B) and MCF‐7 cells (C) via CCK‐8 test at increasing concentration for 24 and 48 h. Cells incubated with only media as a control. D, The pharmaceutical activity studies of free DOX and CDs‐DOX for 24 and 48 h. The concentrations of DOX were 0.2 μg mL−1 and 0.5 μg mL−1. All treatments in this figure were carried out in triplicate. Data are expressed as mean ± SD (n = 3). *P < .05, **P < .01 and ***P < .001
