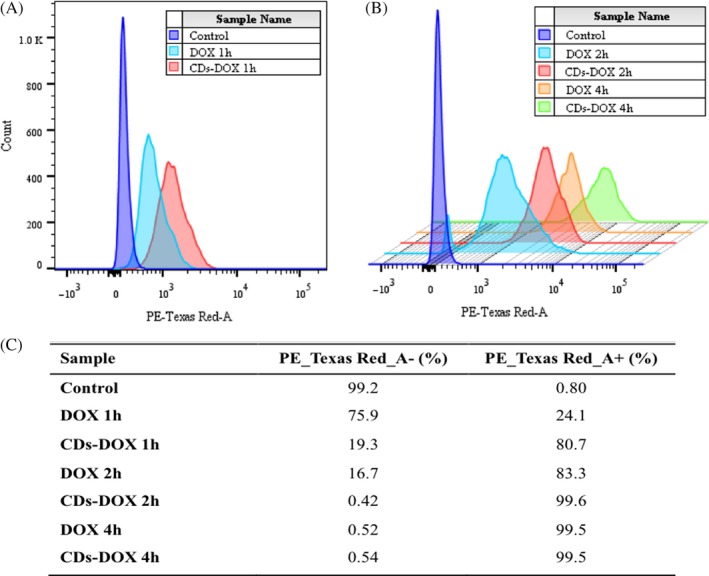
Figure 5.

Cellular uptake of delivery of doxorubicin (DOX) by flow cytometry. A, Flow cytometry profiles of MCF‐7 cells incubated with free DOX and CDs‐DOX for 1 h and (B) 3D flow cytometry histograms of cells after 2‐ and 4‐h incubation (at the same DOX concentration of 0.5 μg mL−1). C, The uptake ratios of all groups. The results exhibited as quantitative mean fluorescence intensities
