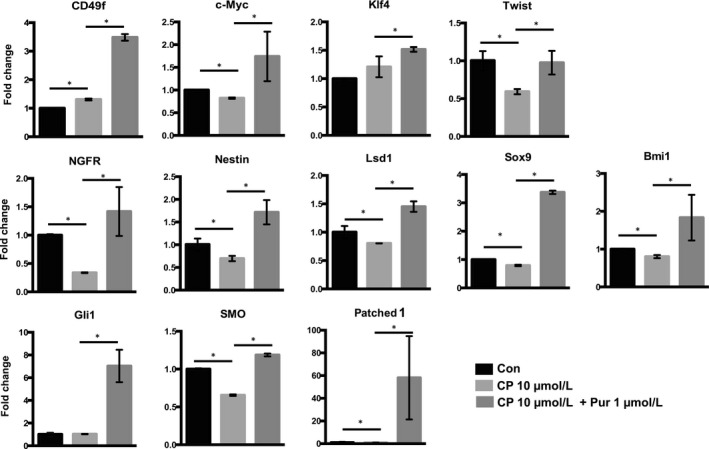
Figure 5.

qPCR analyses of mRNA expression in CP‐treated mSKPs. The mRNA expression of Oct4, Nanog, c‐Myc, Klf4, N‐cad, Twist, NGFR, Smo, Nestin, Lsd1, Bmi1, Sox9, Patehed1 and Gli1 was measured in CP‐ and Pur‐treated mSKPs. Values were normalized against GAPDH and depicted as fold‐change values relative to the control (no CP and Pur treatment; control value = 1). *P < 0.05
