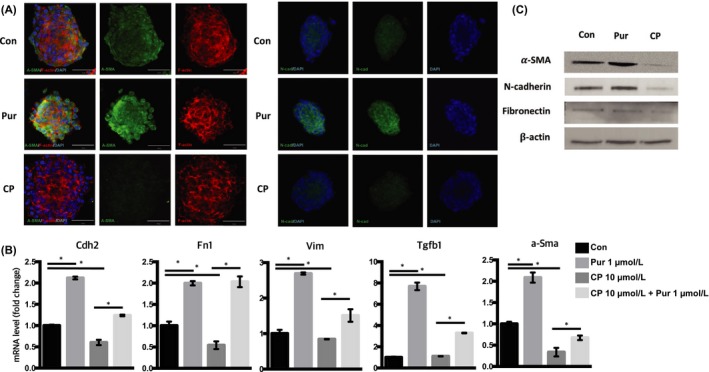
Figure 8.

Regulation of epithelial‐mesenchymal transition (EMT) genes by the Shh signalling pathway. (A) The mSKP spheres after CP or Pur treatment were stained with α‐SMA or N‐cadherin (N‐cad; green), and with F‐actin (red). DAPI (blue) indicates nuclei. (B) The mRNA expression of α‐Sma, Cdh2 (N‐cad), vimentin (Vim), fibronectin (Fn1) and Tgf‐β1 was measured by qPCR in CP‐treated mSKPs (with or without Pur) at 72 h. (C) The relative protein levels of α‐SMA, N‐cad and fibronectin were analysed by Western blot analysis. The housekeeping protein β‐actin was used to control for loading. *P < 0.05. Scale bars: 50 μm
