Figure 5.

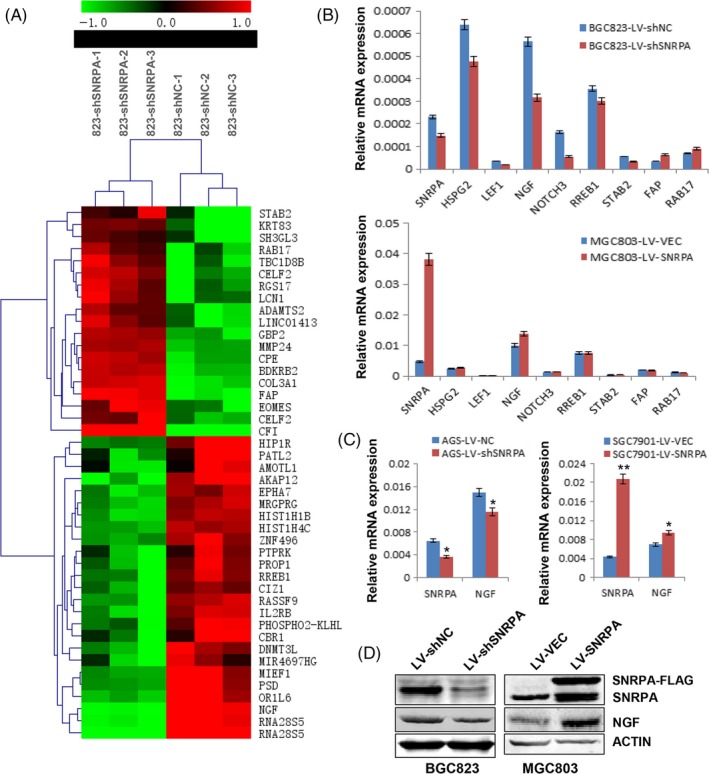
Target gene identification by global microarray analysis and effects of SNRPA on the expression of NGF in GC cells. A, The heatmap of differentially expressed genes which Fold‐change >2.5. Row represents gene, column represents experimental cells as indicated. Upregulated genes are shown in red and downregulated genes in green. B, Verifications of SNRPA target genes in SNRPA silenced BGC823 cells and SNRPA overexpressed MGC803 cells. C, The expression of NGF was evaluated in AGS, SGC7901 and their corresponding control cells by real‐time PCR in which SNRPA was silenced (AGS) or overexpressed (SGC7901). D, The protein expression of NGF was detected by western blot in BGC823 or MGC803 cells. SNRPA has a positive effect on NGF expression. The PCR data are expressed as mean ± SD. *P < .05, **P < .01
