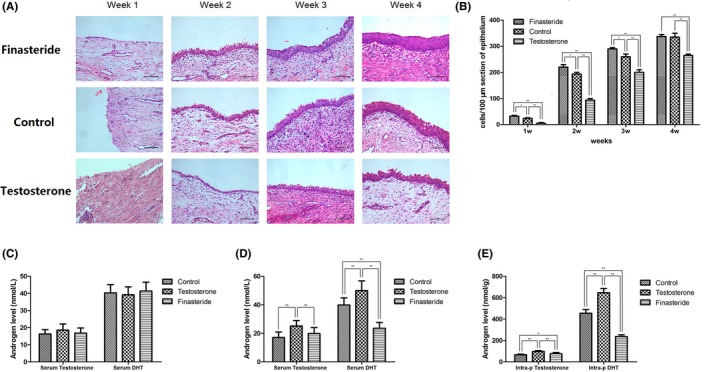
Figure 1.

(A) H&E straining of the prostate sample at each time point after operation. (B) Quantification of regenerative epithelium. (C) Serum testosterone and DHT level before treatment. (D) Serum testosterone and DHT level after treatment. (E) Intra‐prostatic testosterone and DHT level after treatment
