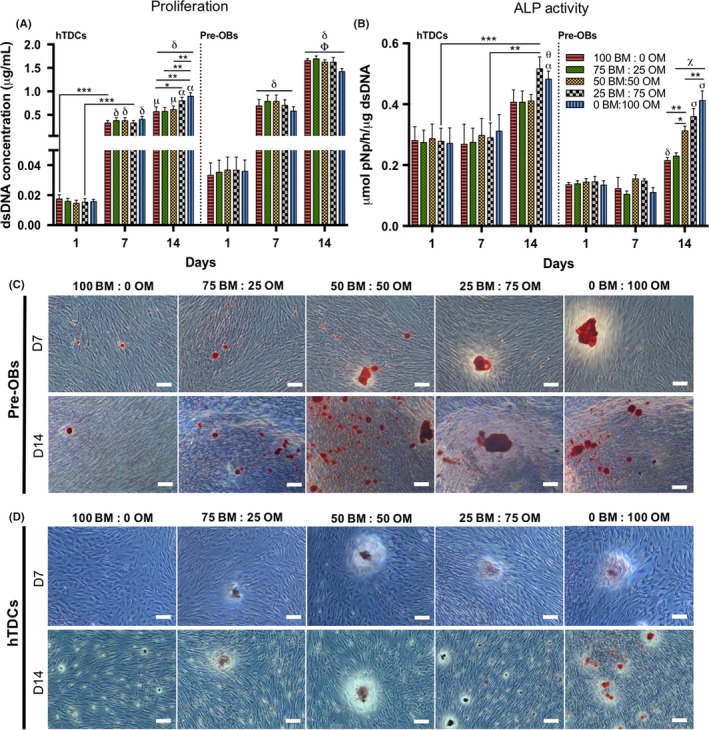
Figure 2.

Evaluation of cell proliferation, alkaline phosphatase activity and matrix mineralization in single cultures of pre‐OBs and hTDCs in the presence of increasing concentrations of osteogenic medium. (A) Cell proliferation, evaluated by dsDNA concentration. Results are presented as mean ± SEM and statistically significant differences are *, P < .05; **, P < .007; ***, P < .0008; μ, P < .02 where μ is statistically significant in comparison with the same conditions at day 7; α, P < .0001, α is statistically significant in comparison with the same conditions at day 7; δ, P < .0001, δ is statistically significant in comparison with the same conditions at day 1; Φ, P < .0001, Φ is statistically significant in comparison with the same conditions at day 7. (B) Quantification of alkaline phosphatase (ALP) activity by the colorimetric p‐nitrophenol (pNP) assay. Results were normalized against the amount of dsDNA of the correspondent sample and are presented as mean ± SEM. Statistically significant differences are shown as *, P < .02; **, P < .003; ***, P < .0009; α, P < .02, α is statistically significant in comparison with the same condition at day 7; δ, P < .004, δ is statistically significant in comparison with the same conditions at day 1 and 7; θ, P < .003, θ is statistically significant in comparison with the same condition at day 1; χ, P < .0001, χ is statistically significant in comparison with the same conditions at days 1 and 7; σ, P < .0001 σ is statistically significant in comparison with the conditions 100 BM: 0 OM and 75 BM: 25 OM. (C, D) Alizarin red staining, demonstrating matrix mineralization in both (C) pre‐OBs and (D) hTDCs (scale bars, 100 μm). Legend: BM: basal medium; OM: osteogenic medium
