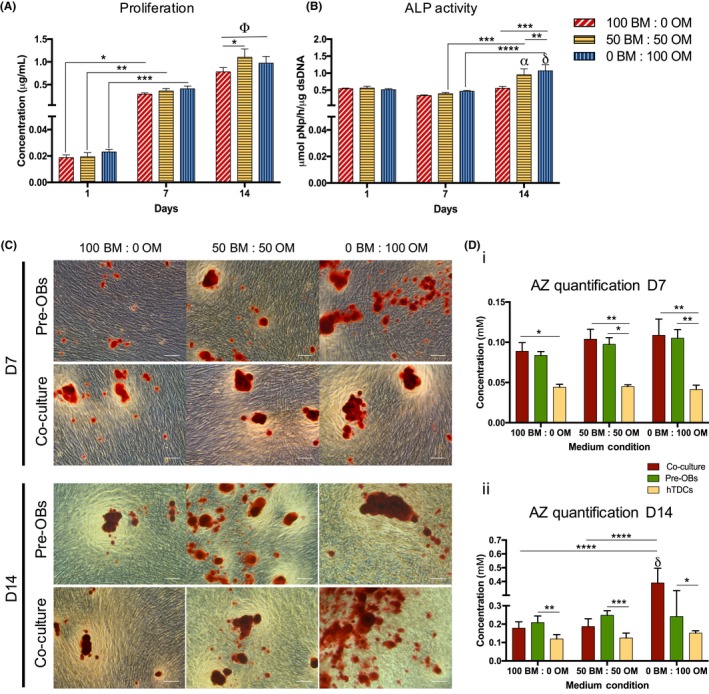
Figure 5.

Evaluation of cell proliferation, alkaline phosphatase activity and matrix mineralization in direct co‐culture. (A) Cell proliferation was quantified by a fluorimetric dsDNA quantification kit. Results are presented as mean ± SEM and statistically significant differences are shown as *, P < .03; **, P < .004; ***, P < .0009; Φ, P < .0001, Φ is statistically significant in correspondence to all the conditions at day 1 and 7. (B) Alkaline phosphatase (ALP) activity was quantified by the colorimetric p‐nitrophenol (pNP). Results are presented as mean ± SEM and statistically significant differences are shown as **, P < .0001; ***, P < .0006; ****, P < .0001; α, P < .0002, α is statistically significant in correspondence to the same condition at day 1; δ, P < .0001, δ is statistically significant in correspondence to the same condition at day 1. (C) Alizarin red (AZ) staining was performed for both pre‐OBs and direct co‐cultures after 7 and 14 days of culture (scale bars, 100 μm). (D) Quantification of AZ staining was performed using cetylpyridinium chloride solution at 7 and 14 days of culture. Results are presented as mean ± SEM and statistically significant differences are shown as *, P < .05; **, P < .009; ***, P < .0003; ****, P < .0001; δ, P < .0001, δ is statistically significant in correspondence to pre‐OBs and hTDCs in the same condition
