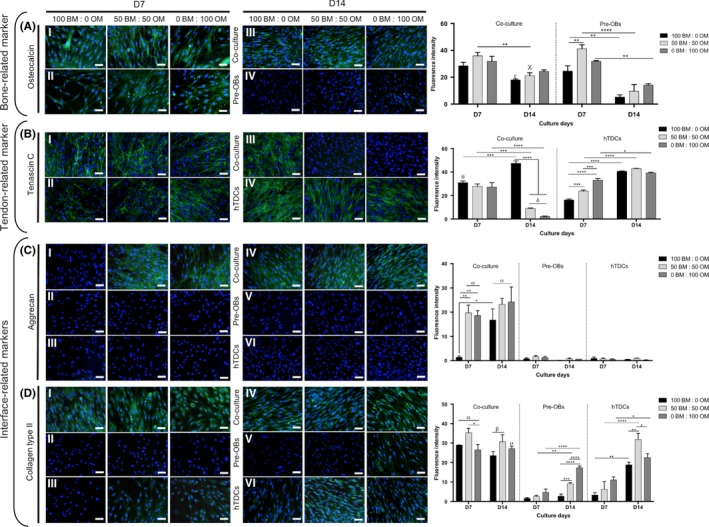
Figure 7.

Expression of bone, tendon‐ and interface‐related proteins in single cultures of pre‐OBs and hTDCs and in direct contact co‐cultures. Fluorescence microscopy images of (A) osteocalcin, (B) tenascin C, (C) aggrecan and (D) collagen type II after 7 and 14 days of culture (scale bars, 50 μm). Nuclei were counterstained with DAPI (blue). Fluorescence intensity quantification was performed. Results are presented as mean ± SEM and statistically significant differences are shown as *, P < .05; **, P < .006; ***, P < .0007; ****, P < .0001; δ, P < .0001, δ is statistically significant in comparison with hTDCs in the same day; α, P < .0001, is statistically significant in comparison with pre‐OBs and hTDCs in the same day; β, P < .0001, is statistically significant in comparison with pre‐OBs in the same day; σ, P < .0001, is statistically significant in comparison with hTDCs in the same day; χ, P < .0003, is statistically significant in comparison with pre‐OBs in the same day; θ, P < .0006, is statistically significant in comparison with hTDCs in the same day; μ, P < .04, is statistically significant in comparison with pre‐OBs in the same day; ε, P < .05, is statistically significant in comparison with pre‐OBs in the same day
