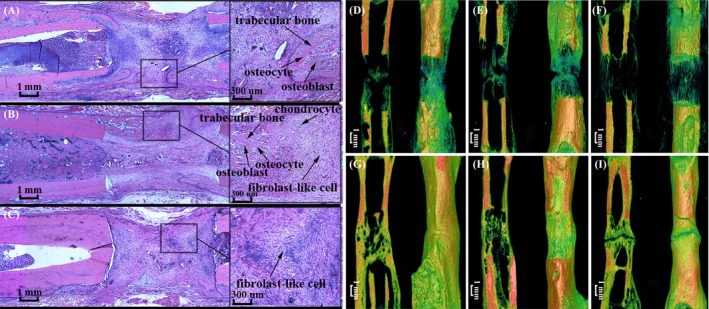
Figure 8.

Representative histological image of the distracted callus from the shRNA‐neg (A), control (B) and shRNA‐Fak group (C). Representative micro‐CT images from the shRNA‐neg (33 days, D and 61 days, G), control (33 days, E and 61 days, H) and shRNA‐Fak group (33 days, F and 61 days, I). The results of the histology and micro‐CT showed a poor early and late osteogenic effect in the ShRNA‐Fak group (C, F and I). (n = 8 rats/group)
