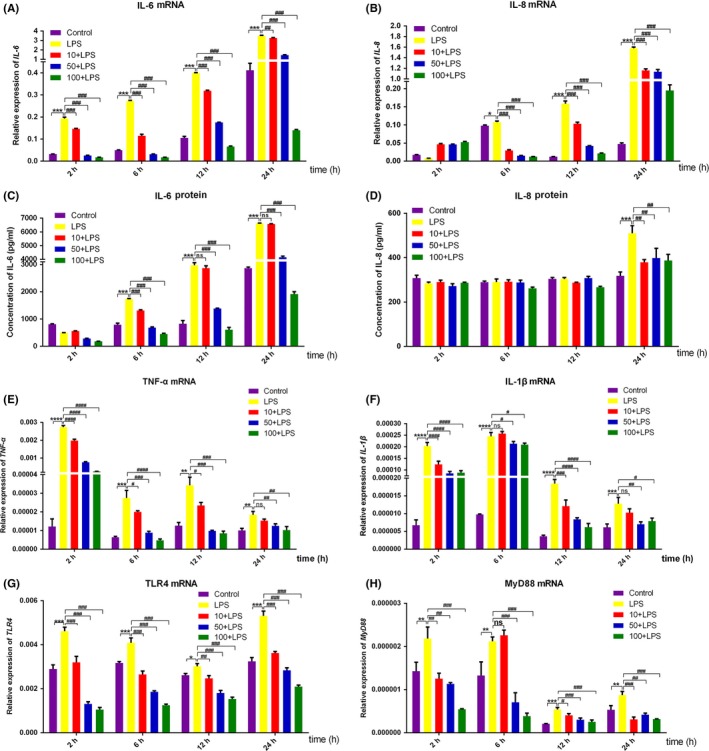
Figure 2.

Effects of DMOG on LPS‐induced inflammatory cytokines, TLR‐4 and MyD88 expression. HGFs were pretreated with 10, 50 and 100 μmol/L DMOG for 24 h, followed by LPS stimulation for 2, 6, 12 and 24 h. (A, B, E‐H) The gene level of IL‐6 (A), IL‐8 (B), TNF‐α (E), IL‐1β (F), TLR4 (G) and MyD88 (H) were determined with qRT‐PCR. (C, D) Culture supernatants were collected to evaluate the protein level of IL‐6 (C) and IL‐8 (D) by ELISA. Histograms represented means ± SD of relative quantification from three independent experiments. ****P < 0.0001, ***P < 0.001, **P < 0.01 and *P < 0.05 compared with control group; ####P < 0.0001, ###P < 0.001, ##P < 0.01, and #P < 0.05 compared with LPS alone group
