
Figure 4.
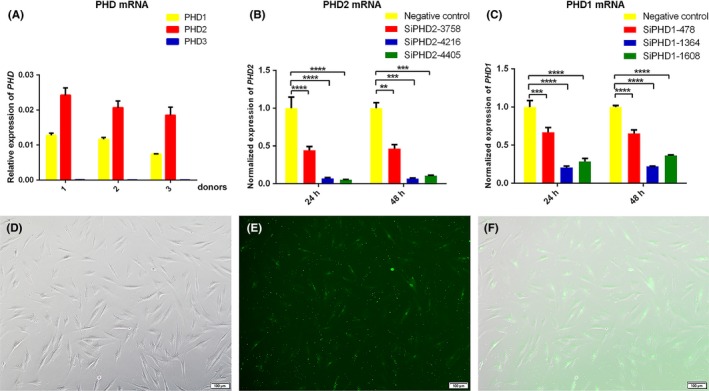
The relative expression of three PHD isoforms and effects of PHD1/2 knockdown. (A) The relative expression of three PHD isoforms was assessed with qRT‐PCR in HGFs from three donors. (D) HGFs transfected with 30 nmol/L FAM‐siRNA were observed under an inverted microscope. (E) Representative image under a fluorescence microscope after transfection. (F) Representative merge images of (D) and (E) (Magnification ×100, scale bar 100 μm). (B, C) HGFs were transfected with siRNA for 6 h and total RNA were extracted after 24 and 48 h. The relative expression of PHD1 (C) and PHD2 (B) were normalized to negative control group. Data represented means ± standard deviation (SD) from three independent experiments. ****P < 0.0001, ***P < 0.001, and **P < 0.01 compared with negative control group