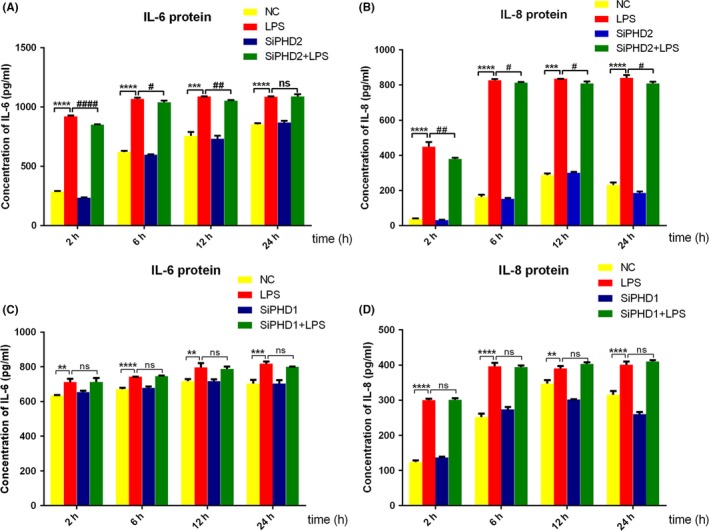
Figure 6.

Effects of PHD1/2 knockdown on LPS‐induced IL‐6 and IL‐8 protein expression. HGFs were respectively transfected with siPHD1 (C, D) and siPHD2 (A, B) and stimulated with LPS for different timings. The culture supernatants were harvested to evaluate the secretion protein level of IL‐6 (A, C) and IL‐8 (B, D) by ELISA. Data represented means ± SD from three independent experiments. ****P < 0.0001, ***P < 0.001 and **P < 0.01 compared with negative control group; ####P < 0.0001, ##P < 0.01, and #P < 0.05 compared with LPS alone group. NC: negative control
